|
LID COOLED CAVITY

|
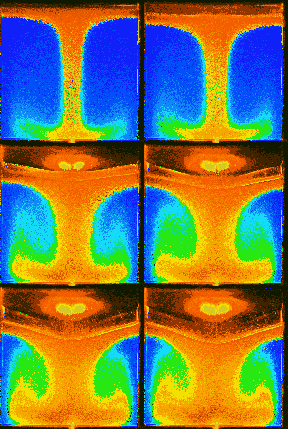
Natural convection of water in the box cooled from the top. The top
isothermal wall is kept at -10C.
Side walls made of Plexiglas permit heat transfer to the cavity
from an external bath kept at temperature 20C.
Propagation of the ice front from the top wall visible.
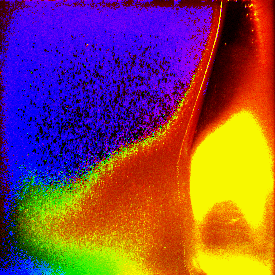
The cold liquid (red colour of the liquid crystal tracers) separates from
the ice surface and flows down to the bottom along the box axis.
Next it warms up (change colour from red, through green to blue),
and returns along side walls back to the top.
[48-50,60].
|
|
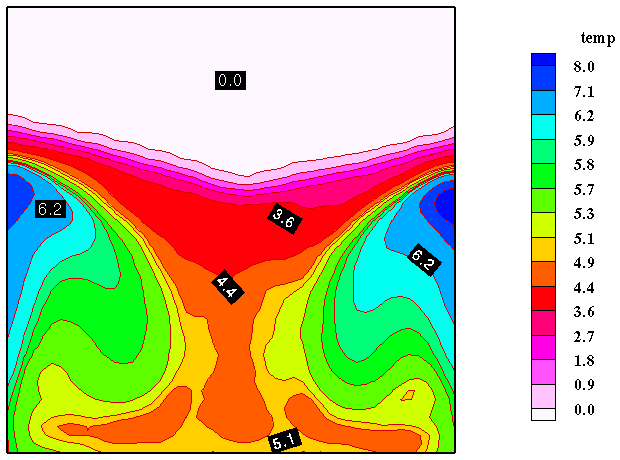
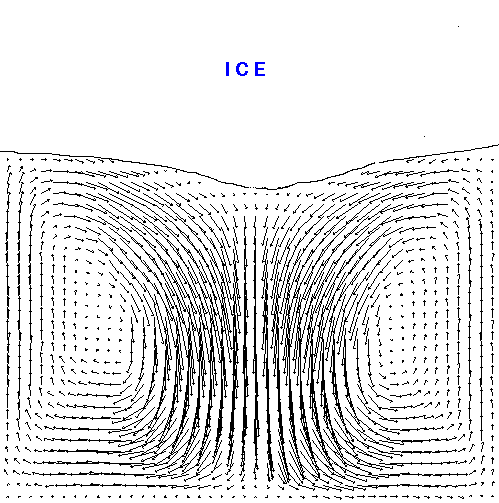
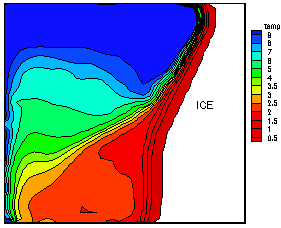
Image analysis allows quantitative evaluation of the colours. It gives
full 2D temperature field (Particle Image Thermometry). The cross-correlation
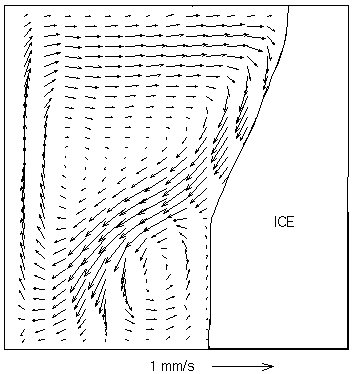
of two images taken at some time interval allows to evaluate full 2D velocity
field (Particle Image Velocimetry). Latest improvement of PIV evaluation
- application of
Optical Flow based on the use of Dynamic Programming
[56,61].
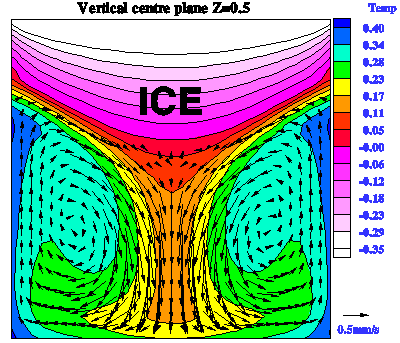
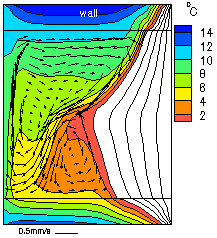
PIT & V allows direct comparison of the experimental data with their numerical counterparts
|
DIFFERENTIALLY HEATED CAVITY
This flow configuration resembles a popular "bench mark" case, natural convection in a cubical cavity with differentially heated end walls [52,53,55,57,59,60,62,64,66,71,72,74] . However, the behaviour of natural convection of water in the vicinity of the freezing point creates interesting and also difficult for numerical modelling flow structures. The competing effects of positive and negative buoyancy force result in a flow with two distinct circulations. First one, "normal" clockwise circulation, where the water density decreases with temperature (upper-left cavity region) and an "abnormal" one with the opposite density variation and counter-clockwise rotation (lower-right region). The convective heat transfer from the hot wall is limited by the abnormal circulation, separating it form the freezing front. Hence, the phase front which is only initially flat, with time becomes strongly deformed, with a characteristic "belly" at its lower part. This type of the flow structure appears very sensitive to thermal boundary conditions at the side walls. Despite improvements of the numerical model (side walls are included in the computational domain), the computational results differ in detail from their experimental counterparts.
|
 |
 |
 |
An eventual source of observed discrepancies could be
supercooling of water, which delays creation of the first ice layer and
deforms the flow pattern at the top of the cavity. It is well known that
pure water may supercool as far as 40oC, before freezing occurs.
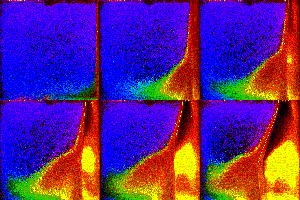
Movie below shows sequences of the flow images taken during 3000s of the
freezing experiment.
|
Initially the whole cavity and fluid is at hot wall temperature.
The experiment starts by abruptly dropping the cold wall
temperature to -10oC. At the first moment a red plume of water
at temperature well below freezing point moves along the cold wall to the
top of the cavity (red colour of TLC indicates cold liquid). It may cover
as much as 30% of the upper wall before sudden solidification occurs (usually
after 30-100s). An ice layer developed at the top quickly melts due to
the hot clockwise circulation, but initial disturbance of the flow and
temperature fields may affect the front propagation for a longer period.
3-D numerical simulations illustrate
well the complex flow structure appearing
in the differentially heated cavity.
Look at the AVS supported visulization
(ICM),
showing particle tracks generated from the 3-D solutions
for natural convection
and freezing of water.
Two complex spiralling motions
are present due to the water density annomaly.
Tomasz A. Kowalewski