Slope flow
Motivation
|
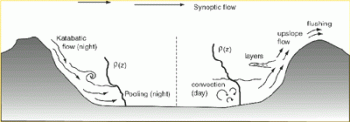
Fig. Idealized basin topography as a description of complex terrain |
ASU VTMX 2000 - Field experiment in Utah
14 organisations participate in the project. During the field experiment at 11 locations several monitoring instruments were deployed, such as:
* Doppler lidars - wind velocity * Radar wind profiler, Turbulent Eddy Profiler * Sodars , lidars for aerosol * Chemical sensors * Tracers (perfluorocarbon) * Dusttracker, TEOM * Sonic, cup anemometers * Tether balloons, aircraft, model aircraft |
|
---|
Why vertical transport ? Convective boundary layer (CBL) develops due to heating of air adjacent to the ground, and grows during the day while destroying the stable stratification of the prevailing layer aloft. The growth, and hence vertical transport, of the CBL is governed by convective turbulence as well as by the entrainment at the capping inversion bounding the CBL. Kelvin - Helmholz instabilities enhance vertical transport.
Why complex terrain ?
To improve WPM we need:
|
Introduction
|
||
|
The natural convection of water in inclined side-heated rectangular box was investigated both experimentally and numerically. The cavity had aspect ratio L/H = 3, the two opposite walls isothermal walls were kept at different temperatures, and four other walls adiabatic. The working fluid was water. The enclosure inclination j varied from 0 to 90 deg. The Rayleigh number modified by cos j varied in the range of 1×10⁶<Ray<7.5×10⁶. Particle image velocimetry (PIV) and particle image thermometry (PIT) were used for quantitative analysis of the temporary velocity and temperature fields generated in the cavity. The numerical simulations of selected configurations were carried out and compared with the experimental data. |
|
|
|
|
Experiment
|
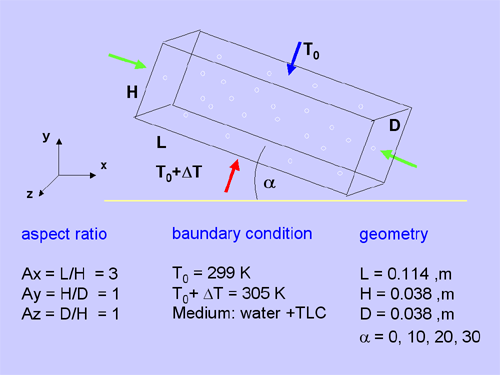
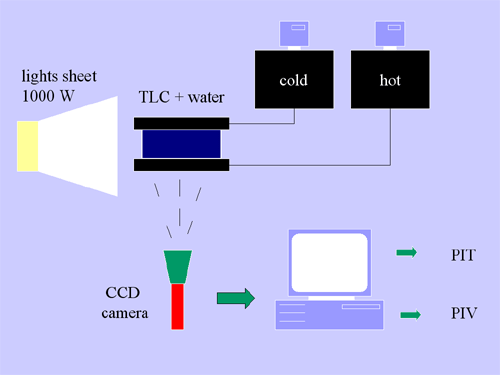
We considered natural convection in a rectangular inclined enclosure filled with water (Fig. 1a). The cavity was of H=38 mm height, D=38 mm depth and L=114 mm length. The four adiabatic side-walls were made from 7.5 mm thick Plexiglas. The other two isothermal side-walls were made of copper. The temperature difference between the isothermal walls were kept at constant value DT=6K. The temperatures of the hot wall Th and cold wall Tc, were 305K and 299K, respectively. The cavity inclination angle j varied from 0o ‑ 90o. The acquisition system (Fig. 1b) consisted of the 3CCD colour camera (Sony XC003P) and the 32-bit frame grabber (IC-PCI ITI). The flow field was illuminated with a 2 mm thin sheet of white light from a specially constructed 1000 W halogen lamp, and observed in the perpendicular direction. The thermochromic liquid crystal (TLC) tracers, changing colour of refracted light with temperature were employed to measure both temperature and velocity flow fields. The temperature measurements were based on a digital colour analysis of the flow images.
|
|||
|
|
||
Fig. 1a Experimental cavity |
Fig. 1b Experimental apparatus |
|
Numerical set-up
|
|||
|
Numerical simulations of the investigated experimental configurations were performed using finite-volume commercial code Fluent 6.1.18 (Fluent Inc., USA). Spatial derivatives were approximated using QUICK scheme, which is based on a weighted average of second-order-upwind and central interpolation of the variable. Pressure-velocity coupling was done using SIMPLE algorithm. Solutions were obtained by direct simulations of the flow for two-dimensional and three-dimensional uniform structural mesh using double precision solver. The solutions when residuals approach given value 10-5 and 10-6, respectively.
A numerical investigation has been made of two-dimensional natural convection of water in an externally heated vertical or inclined rectangular cavity containing uniformly distributed internal energy sources. Results have been obtained for Rayleigh number up to 106 and inclined of 0, 10, 20, 30, 40, 50, 60, 70, 80, 90 deg. The Fluent package 6.0.20. have been used to solve unsteady Navier-Stokes equations for dwo-dimensional in rectangular cavity. The governing partial differential equations are the ones express the conservation of mass momentum and energy using the Boussinesq approximation. |
||
Experimental
results
|
|||
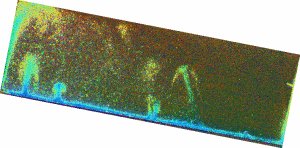
The experimental temperature field is shown on the movie presented below |
|||
Fig. 2 Temperature contours for 20 angle, experimantal at Ra=106 |
|||
Numerical
results
|
|||
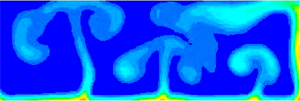
The numerical temperature field and velocity field are shown on the movies presented below. The boundary conditions have been the same like in experiment. |
|||
Fig. 3 Temperature contours for 0 deg. |
Fig. 4 Velocity field for 0 deg. |
||
Fig. 5 Temperature contoursfor 10 deg. |
Fig. 6 Velocity field for 10 deg. |
||
Fig. 7 Temperature contours for 20 deg. |
Fig. 8 Velocity field for 20 deg. |
||